
Index
In our previous STT analyses, we mainly focused on how Speech-to-Text engines performed for Dutch and English. From this analysis onwards, we are adding a broader perspective. The STT Analyzer now includes a leaderboard for every locale Seamly currently analyzes.
This makes it easier to see how much performance can vary by language. An engine that ranks first for one locale may perform significantly worse for another. We have also added Reson8 as a new STT engine to the analyzer.
For Dutch and English, we continue with the same in-depth analysis as in the previous update: we track how correctness and WER develop over time and compare performance across different input types.
How do we test different STT engines?
Our test setup is unchanged from previous analyses. We use a fixed set of test sentences, spoken by native speakers in telephone-quality audio. Each recording is checked to minimize noise in the dataset.
We analyze the output after Seamly has applied normalization and post-processing. This is particularly relevant in voice applications, where postcodes, dates, times and spoken numbers often need to be converted into a consistent format.
Our dataset continues to grow. For some locales, the number of measurements is still limited. The leaderboards for these languages are therefore intended to provide an initial indication of the relative differences within our test setup. The results cannot automatically be generalized to every use case or telephony environment, and should not be interpreted as a market-wide ranking.
What do we test?
From this update onwards, we first look at overall correctness per locale. We currently do this for Dutch, English, French, Finnish, German, Norwegian, Flemish and Swedish.
For Dutch and English, we then go into more detail, as we did in the previous analysis. We track how correctness and Word Error Rate develop over time and compare correctness across different types of input, including numeric data, postcodes, dates and times, text and alphanumeric combinations.
As a quick refresher:
- Correctness indicates how often the output exactly matches the expected input. A higher correctness score is better.
- Word Error Rate, or WER, looks at the number of word-level changes required to make the transcription match the input. For this metric, a lower score is better.
New: a leaderboard for every locale
The table below summarizes the new leaderboards. For each locale, we show the three best-performing services based on correctness. Where scores are equal, services share the same position.
| Locale | Three best-performing services based on correctness | ||
| Best | Second best | Third best | |
| Dutch | Azure 77.5% |
GCloud Chirp3 75.0% |
Amazon Transcribe 71.9% |
| English | Reson8 71.4% |
GCloud Chirp3 69.0% |
ElevenLabs 66.7% |
| French | Reson8 70.0% |
GCloud Chirp3 65.0% |
ElevenLabs 55.0% |
| Finnish | GCloud Chirp3 60.4% |
Azure 47.9% |
Speechmatics 39.6% |
| German | GCloud Chirp3 64.5% |
Reson8 61.8% |
Azure 56.6% |
| Norwegian | Amazon Transcribe 58.8% |
Azure 48.8% |
GCloud Chirp3 47.5% |
| Flemish | Azure 70.2% |
Speechmatics 70.2% |
GCloud Chirp3 61.7% |
| Swedish | Amazon Transcribe 55.0% |
GCloud Chirp3 55.0% |
ElevenLabs and Reson8 50.0% |
The table immediately shows why we evaluate STT engines by language. No single provider ranks first across every locale.
Chirp3 stands out for the breadth of its performance. It ranks among the stronger services for every locale in the current dataset and leads the Finnish and German results. For Swedish, Chirp3 shares the highest correctness score with Amazon Transcribe.
Other providers are particularly strong for specific languages. Azure leads the Dutch results and shares the top score for Flemish with Speechmatics. Amazon Transcribe performs best for Norwegian.
Reson8 also makes a strong first appearance. It has the highest correctness in the current dataset for both English and French, and is also one of the stronger services for German.
These differences reinforce a key point from our earlier analyses: STT performance needs to be assessed per language. Some datasets are still relatively small, so these results should be interpreted with caution. For these locales, the leaderboard mainly provides a first indication and will become more reliable as we collect more test data.
English STT analysis
Reson8 makes a strong entry
For English, the picture has changed compared with our previous analysis. Reson8 now leads the current results and immediately joins the group of engines we are watching closely for English.
The trend over time also shows that this position is not based on a single measurement. Reson8's correctness improves noticeably across the measurement period, although the increase is not completely linear. By the end of August, it reaches just over 71%.
Chirp3 remains relatively stable. This is particularly relevant because Chirp3 emerged as the strongest English service in our May analysis. While Chirp3 maintains roughly the same level of performance, Reson8 gains considerable ground during the current measurement period.
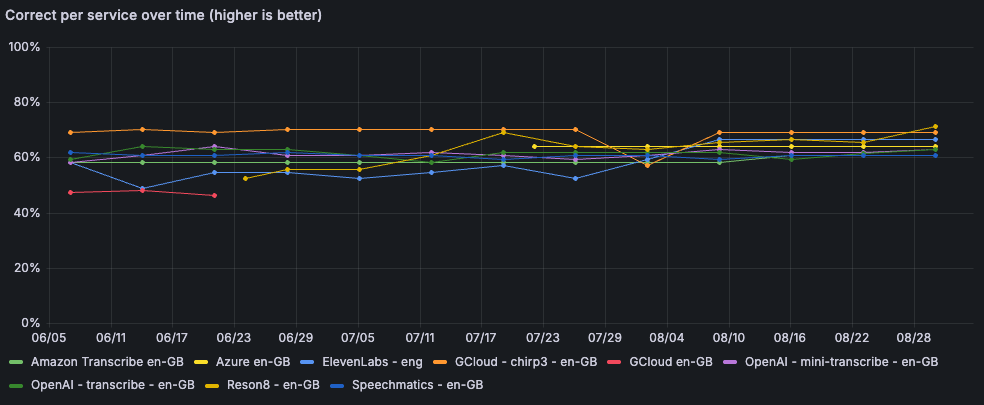
Image 1: Correctness per STT engine - English (click to enlarge)
Input type still has a major impact
When we break the results down by input type, the pattern from previous analyses remains visible. Strong overall correctness does not mean an engine performs equally well on every type of input.
Alphanumeric input continues to show large differences between services. This is particularly relevant in conversations where callers need to provide customer numbers or other combinations of letters and digits.
For postcodes, several services are closer together and generally achieve better results. Dates, times and numeric input again produce their own differences between engines.
For a specific voice use case, it therefore remains important to look beyond the overall score. The type of information callers need to provide can be just as important as the average correctness when selecting an engine.

Image 2: Correctness per entry type - English (click to enlarge)
Reson8 shows a sharp decline in WER
The clearest development in English WER can be seen with Reson8. The first measurements are very high, after which the Word Error Rate drops significantly within a relatively short period. By the end of the measurement period, its WER is much closer to that of the other stronger-performing engines.
This matches the trend we see in correctness. Both metrics indicate that Reson8's English performance improved considerably during this period.
Chirp3 shows a much steadier pattern. Its performance remains relatively stable over time, although WER ends slightly higher than in the earlier measurements. Most of the other services show smaller movements.
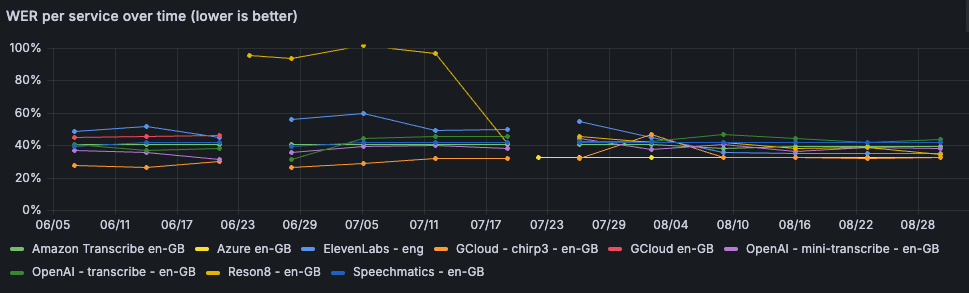
Image 3: WER per STT engine - English (click to enlarge)
Dutch STT analysis
Azure remains strong as Amazon's previous growth levels off
For Dutch, there is less movement at the top of the leaderboard. Azure once again has the highest overall correctness and remains stable at a high level throughout the available measurement period.
For Amazon Transcribe, the comparison with the May analysis is particularly interesting. In the previous analysis, we still saw a clear improvement in its Dutch performance. In the current period, that rapid growth appears to have levelled off, with correctness remaining at roughly the same level.
Chirp3 also stays close to the top of the Dutch leaderboard. Its correctness declines slightly over the measurement period, but it remains one of the stronger services for Dutch.
Reson8 also enters the Dutch results at a relevant level. Its measurements fluctuate more than those of the established leaders, but by the end of the period its correctness is around 70%.
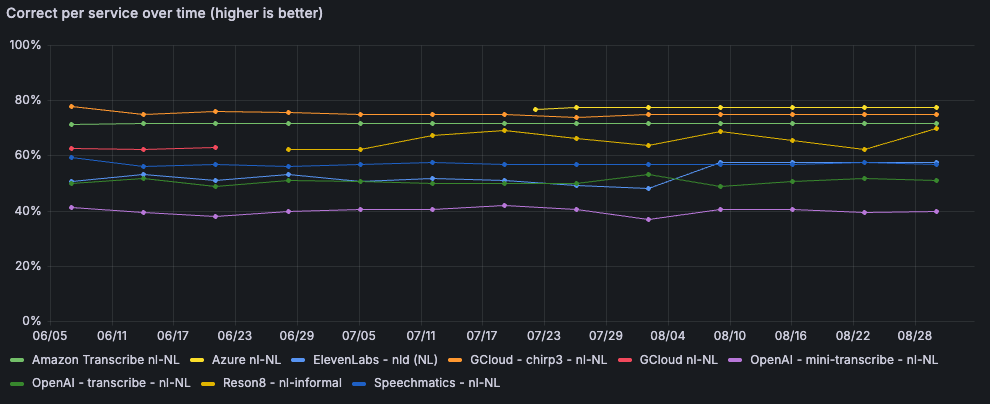
Image 4: Correctness per STT engine - Dutch (click to enlarge)
Structured input continues to reveal large differences
The Dutch input-type results again show that some categories are handled much more consistently than others.
Numeric input is processed quite reliably by several of the stronger engines. The differences become more pronounced for postcodes. Alphanumeric input remains clearly more difficult and produces lower correctness for almost every service.
This pattern matters more than a few percentage points of difference in the overall score. For a voicebot in which callers frequently provide numbers, postcodes or combinations of letters and digits, the preferred engine may therefore differ from one used mainly for free-form speech.
Reson8 also shows why this breakdown is useful. It performs strongly on some forms of structured input, while other categories still leave more room for improvement.

Image 5: Correctness per entry type - Dutch (click to enlarge)
Azure and Chirp3 remain strong on WER
Azure also remains strong and stable when we look at Dutch Word Error Rate. Chirp3 continues to sit among the lower-WER services as well.
For Reson8, the movement is consistent with what we see in correctness: the output becomes more consistent over the measurement period, and WER ends considerably lower than in the earlier measurements.
The OpenAI services continue to require relatively more word-level corrections within our test setup. This is consistent with what we observed in previous Dutch analyses.
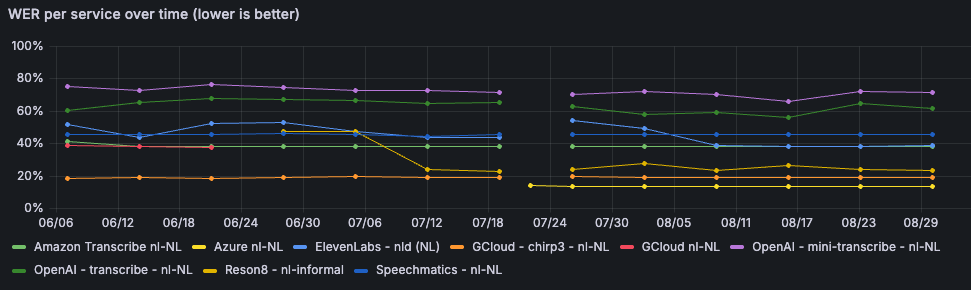
Image 6: WER per STT engine - Dutch (click to enlarge)
What has changed since May?
The May analysis was mainly characterized by the continued improvement of Amazon Transcribe for Dutch, while Chirp3 remained strong and stable for English. ElevenLabs had only just been added to the benchmark at that point.
Three months later, the biggest change is in the English results. Chirp3 continues to perform consistently, but Reson8 has moved ahead of it in the current measurements. The sharp reduction in Reson8's WER during the period makes this development especially interesting to follow in future analyses.
For Dutch, we see more continuity. Azure remains strong. Amazon Transcribe's earlier rapid improvement appears to have stabilized for now, while Chirp3 also remains close to the top.
The new leaderboards add another dimension that was not shown in this way in the May analysis. We can now compare the strongest-performing services across all the locales currently included in the analyzer. For languages with smaller datasets, these results should still be treated as indicative.
How do we use these insights?
We use these analyses to determine which STT engines are relevant for a particular language and voice use case. The average correctness score is only one part of that assessment. The type of information a caller needs to provide also plays an important role.
A voicebot that mainly processes free-form speech has different requirements from an application in which callers frequently provide postcodes, customer numbers, dates or alphanumeric codes. The input-type analysis helps us make that distinction more concrete.
Tracking performance over time is equally important because STT performance can change. Reson8's development in this analysis is a clear example. By measuring continuously, we can reassess an existing engine choice when the data gives us a reason to do so.
We also use the same data to improve Seamly's own normalization and post-processing. The STT Analyzer therefore helps us both in selecting the most suitable engine and in improving how its output is processed within the Seamly platform.
For our partners, this means STT decisions can be supported by recent measurements from telephony scenarios, with attention to both the language and the type of input involved in the specific use case.
Want to know more?
We will continue to expand the STT Analyzer with new measurements, locales and STT engines. As the datasets for each language grow, we will be able to assess developments over longer periods with greater confidence.
Want to see how Seamly can extend your conversational platform to the telephony channel, and how we incorporate STT choices into that process? We would be happy to show you using your own use case! Contact us now.